Raw Data

Script / Documentation


Welcome to Just Facts Academy, where you learn how to research like a genius.

Remember, you don’t have to be an Einstein to be a great researcher. You simply need to put in the effort and apply the 7 Standards of Credibility that we share in this video series.

Today’s lesson: Raw Data.

Let’s define raw data, explain why it’s essential by using a real-world example, and show you how to use this standard in your own research.

Raw data simply means the actual numbers, procedures, and formulas used—the original information before descriptions are given and conclusions are drawn.

Why is this so important?

Because people are people. They make mistakes, jump to false conclusions, and they’re not always honest. By examining the raw data, you can lessen the chances that you’ll get fooled by misinformation and then spread it.

This is more than just a grade. Misinformation can harm and even kill people. That’s why books about academic integrity emphasize that researchers should be completely transparent with their sources, facts, data, and methods so that other people can readily check their results.[1] [2] [3] [4]

Real transparency requires raw data.

Here’s an example of this in action: Back in 2010, a scholarly journal called the American Economic Review published a groundbreaking study based on more than 2,000 data points. It found that nations with large national debts had poor economic growth.[5] This is important because poor economic growth goes hand-in-hand with hunger, homelessness, poverty, short lifespans, and low levels of education.[6]

Three years later, however, researchers from the Political Economy Research Institute found a significant error in the study. They were able to do this because the authors of the original study made the raw data publicly available.[7] [8]

Mistake fixed. Problem solved, right? Not even close!

You see, the researchers who discovered the error ran new calculations but then buried their results and distorted them.

Stick with me here, because this is shocking and provides a great lesson.

In the opening paragraph of their study, these scholars claimed that economic growth “is not dramatically different” whether national debts are low or high.[9]

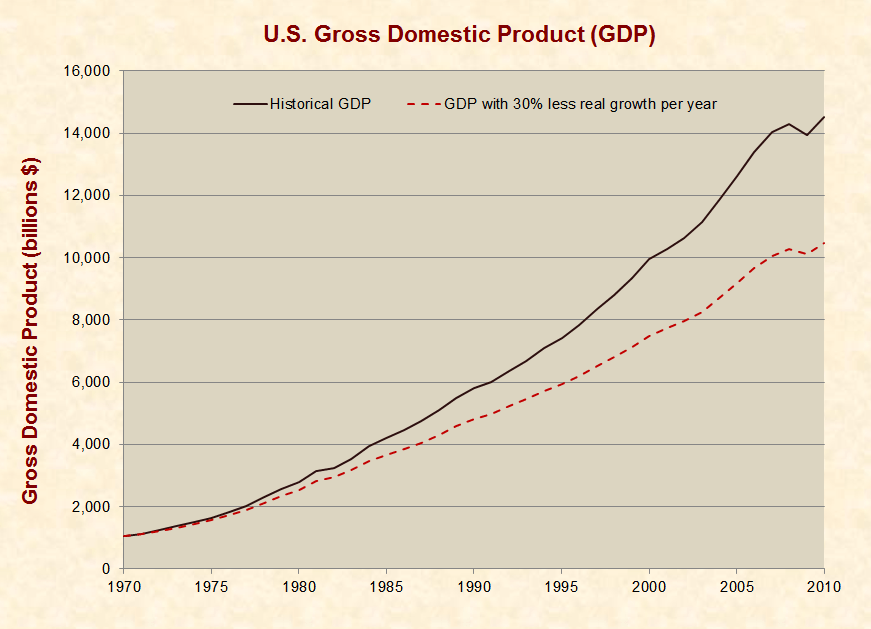
Wait a second? What do they mean by “not dramatically different?” Well, one has to dig 10 pages into their study to find the actual data. And guess what it shows? The same basic result as the original study: Economic growth in nations with high levels of debt averages about 30% below those nations with moderate levels of debt—and nearly half as low as nations with low levels of debt.[10] [11] [12]

Yet, instead of examining the raw data for this study, media outlets widely parroted the authors’ misleading summary.[13] The end result? Citizens and policymakers were fed a blatant falsehood about an issue with life-or-death implications.[14]

And due to the compounding effect of growth rates, this can cause real damage over time.[15]

Compounding Effects of 30% Less GDP Growth Per Year

Now that you see the importance of raw data, let’s talk about how you can apply it in your own research.

First, be very skeptical of anyone who does not publicly share their raw data or places it where few people will see it. No matter how impressive someone’s academic credentials may be, they are not above making mistakes or being deceitful.

Even the peer-review process, which is called the “gold standard” of academic integrity, has produced thousands of papers that have been retracted due to errors and deliberate fraud.[16] [17] [18] [19]

Bottom line: When people don’t readily share their raw data, it’s a big red flag.

Even if you don’t have the math skills to check their work, other people do. And when raw data is available, everyone can check everyone else’s results. This is how good science works.

Second, don’t settle for subjective descriptions like “not dramatically different.” When you read something like that, your first thought should be, “What are the actual numbers?” And your next question: “Are there margins of error on those numbers?” and if so, “What are they?”

Third, make the time and effort to find the raw data and vet it. Raw data doesn’t just consist of numbers but also statements and events. Journalists are infamous for quoting people out of context, and scholars often twist statistics, so don’t blindly trust them.

Instead, read full transcripts, watch the entirety of uncut videos, read full studies, and scrutinize the data before you come to a firm conclusion.

What if you don’t have the time to do that? No one can force you to have an opinion, so remain agnostic and fight the common tendency to uncritically accept anything that aligns with your current views.

The great scientist Louis Pasteur displayed keen insight into human nature when he wrote that “the greatest aberration of the mind is to believe a thing to be, because we desire it.”[20]

Take note—none of these 3 steps requires a high IQ or a college degree. They only require some work and intellectual honesty.

So apply the Raw Data standard and the rest of Just Facts’ Standards of Credibility, so you can research like a genius.


Footnotes

[1] Handbook of Data Analysis. Edited by Melissa Hardy and Alan Bryman. Sage Publications, 2004. Introduction: “Common Threads Among Techniques of Data Analysis.” By Melissa Hardy and Alan Bryman. Pages 1–14.

Page 7:

Both Argue the Importance of Transparency

Regardless of the type of research being conducted, the methodology should not eclipse the data, but should put the data to optimal use. The techniques of analysis should be sufficiently transparent that other researchers familiar with the area can recognize how the data are being collected and tested, and can replicate the outcomes of the analysis procedure. (Journals are now requesting that authors provide copies of their data files when a paper is published so that other researchers can easily reproduce the analysis and then build on or dispute the conclusions of the paper.)

[2] Book: Quantifying Research Integrity. By Michael Seadle. Morgan & Claypool, 2017.

Page 43: “[D]ata falsification comes from an excess of creativity—creating data to produce particular results. … [A]n important goal in the social sciences is that results, and therefore the data, be reproducible. There may be legal questions about whether the process that produces a particular result has been patented and thus protected, but data in and of themselves have no legal protection in the U.S.”

Page 44: “When data are not available, researchers must either trust past published results, or they must recreate the data as best they can based on descriptions in the published works, which often turn out to be too cryptic. … Descriptions are no substitute for the data itself.”

[3] The Handbook of Social Research Ethics. Edited by Donna M. Mertens and Pauline E. Ginsberg. Sage, 2009. Chapter 24: “Use and Misuse of Quantitative Methods: Data Collection, Calculation, and Presentation.” By Bruce L. Brown and Dawson Hedges. Pages 373–386.

Page 384:

Science is only as good as the collection, presentation, and interpretation of its data. The philosopher of science Karl Popper argues that scientific theories must be testable and precise enough to be capable of falsification (Popper, 1959). To be so, science, including social science, must be essentially a public endeavor, in which all findings should be published and exposed to scrutiny by the entire scientific community. Consistent with this view, any errors, scientific or otherwise, in the collection, analysis, and presentation of data potentially hinder the self-correcting nature of science, reducing science to a biased game of ideological and corporate hide-and-seek.

… Any hindrance to the collection, analysis, or publication of data, such as inaccessible findings from refusal to share data or not publishing a study, should also be corrected for science to fully function.

[4] Editorial: “No Raw Data, No Science: Another Possible Source of the Reproducibility Crisis.” Molecular Brain, February 21, 2020. <molecularbrain.biomedcentral.com>

Page 1:

A reproducibility crisis is a situation where many scientific studies cannot be reproduced. Inappropriate practices of science, such as HARKing, p-hacking, and selective reporting of positive results, have been suggested as causes of irreproducibility. In this editorial, I propose that a lack of raw data or data fabrication is another possible cause of irreproducibility.

As an Editor-in-Chief of Molecular Brain, I have handled 180 manuscripts since early 2017 and have made 41 editorial decisions categorized as “Revise before review,” requesting that the authors provide raw data. Surprisingly, among those 41 manuscripts, 21 were withdrawn without providing raw data, indicating that requiring raw data drove away more than half of the manuscripts. I rejected 19 out of the remaining 20 manuscripts because of insufficient raw data. Thus, more than 97% of the 41 manuscripts did not present the raw data supporting their results when requested by an editor, suggesting a possibility that the raw data did not exist from the beginning, at least in some portions of these cases.

Considering that any scientific study should be based on raw data, and that data storage space should no longer be a challenge, journals, in principle, should try to have their authors publicize raw data in a public database or journal site upon the publication of the paper to increase reproducibility of the published results and to increase public trust in science.

Page 5:

There are practical issues that need to be solved to share raw data. … For these technical issues, institutions, funding agencies, and publishers should cooperate and try to support such a move by establishing data storage infrastructure to enable the securing and sharing of raw data, based on the understanding that “no raw data, no science.”

[5] Paper: “Growth in a Time of Debt.” By Carmen M. Reinhart (University of Maryland) and Kenneth S. Rogoff (Harvard University). American Economic Review, May 2010. Pages 573–578. <scholar.harvard.edu>

Page 573:

In this paper, we exploit a new multi-country historical dataset on public (government) debt to search for a systemic relationship between high public debt levels, growth and inflation.1 Our main result is that whereas the link between growth and debt seems relatively weak at “normal” debt levels, median growth rates for countries with public debt over roughly 90 percent of GDP are about one percent lower than otherwise; average (mean) growth rates are several percent lower. Surprisingly, the relationship between public debt and growth is remarkably similar across emerging markets and advanced economies. …

Our results incorporate data on 44 countries spanning about 200 years. Taken together, the data incorporate over 3,700 annual observations covering a wide range of political systems, institutions, exchange rate and monetary arrangements, and historic circumstances.

Page 575:

Table 1 provides detail on the growth experience for individual countries, but over a much longer period, typically one to two centuries. Interestingly, introducing the longer time-series yields remarkably similar conclusions. Over the past two centuries, debt in excess of 90 percent has typically been associated with mean growth of 1.7 percent versus 3.7 percent when debt is low (under 30 percent of GDP), and compared with growth rates of over 3 percent for the two middle categories (debt between 30 and 90 percent of GDP). Of course, there is considerable variation across the countries, with some countries such as Australia and New Zealand experiencing no growth deterioration at very high debt levels. It is noteworthy, however, that those high-growth high-debt observations are clustered in the years following World War II.

Page 577: “Our main finding is that across both advanced countries and emerging markets, high debt/GDP levels (90 percent and above) are associated with notably lower growth outcomes.”

[6] Textbook: Macroeconomics for Today (6th edition). By Irvin B. Tucker. South-Western Cengage Learning, 2010.

Page 530: “GDP [gross domestic product] per capita provides a general index of a country’s standard of living. Countries with low GDP per capita and slow growth in GDP per capita are less able to satisfy basic needs for food, shelter, clothing, education, and health.”

[7] Working paper: “Does High Public Debt Consistently Stifle Economic Growth? A Critique of Reinhart and Rogoff.” By Thomas Herndon, Michael Ash, and Robert Pollin. Political Economy Research Institute, April 15, 2013. Revised 4/22/13. <www.peri.umass.edu>

We replicate Reinhart and Rogoff (2010a and 2010b) and find that coding errors, selective exclusion of available data, and unconventional weighting of summary statistics lead to serious errors that inaccurately represent the relationship between public debt and GDP growth among 20 advanced economies in the post-war period. Our finding is that when properly calculated, the average real GDP growth rate for countries carrying a public-debt-to-GDP ratio of over 90 percent is actually 2.2 percent, not -0.1 percent as published in Reinhart and Rogoff. That is, contrary to RR, average GDP growth at public debt/GDP ratios over 90 percent is not dramatically different than when debt/GDP ratios are lower.

Page 19: “As in Figure 3, all available data were used in producing Figure 4. Source: Authors’ calculations from working spreadsheet provided by RR [Reinhart and Rogoff].”

[8] Commentary: “Reinhart and Rogoff: Responding to Our Critics.” By Carmen M. Reinhart and Kenneth S. Rogoff. New York Times, April 25, 2013. <www.nytimes.com>

“We have shared our data with hundreds of researchers and since 2011 have posted the difficult-to-reconstruct historical debt-to-G.D.P. ratios online in thoroughly documented spreadsheets. The project of posting our data set relating to financial crises is a daunting task.”

[9] Working paper: “Does High Public Debt Consistently Stifle Economic Growth? A Critique of Reinhart and Rogoff.” By Thomas Herndon, Michael Ash, and Robert Pollin. Political Economy Research Institute, April 15, 2013. Revised 4/22/13. <www.peri.umass.edu>

Page 1: “Our finding is that when properly calculated, the average real GDP growth rate for countries carrying a public-debt-to-GDP ratio of over 90 percent is actually 2.2 percent, not –0.1 percent as published in Reinhart and Rogoff [RR]. That is, contrary to RR, average GDP growth at public debt/GDP ratios over 90 percent is not dramatically different than when debt/GDP ratios are lower.”

[10] Working paper: “Does High Public Debt Consistently Stifle Economic Growth? A Critique of Reinhart and Rogoff.” By Thomas Herndon, Michael Ash, and Robert Pollin. Political Economy Research Institute, April 15, 2013. Revised 4/22/13. <www.peri.umass.edu>

Page 1: “Our finding is that when properly calculated, the average real GDP growth rate for countries carrying a public-debt-to-GDP ratio of over 90 percent is actually 2.2 percent, not –0.1 percent as published in Reinhart and Rogoff [RR]. That is, contrary to RR, average GDP growth at public debt/GDP ratios over 90 percent is not dramatically different than when debt/GDP ratios are lower.”

Page 10:

Summary: years, spreadsheet, weighting, and transcription

Table 3 summarizes the errors in RR and their effect on the estimates of average real GDP growth in each public debt/GDP category. Some of the errors have strong interactive effects. Table 3 shows the effect of each possible interaction of the spreadsheet error, selective year exclusion, and country weighting.

The errors have relatively small effects on measured average real GDP growth in the lower three public debt/GDP categories. GDP growth in the lowest public debt/GDP category is roughly 4 percent per year and in the next two categories is around 3 percent per year with or without correcting the errors.

In the over-90-percent public debt/GDP category, however, the effects of the errors are substantial. For example, the impact of the excluded years for New Zealand is greatly amplified when equal country weighting assigns 14.3 percent (1/7) of the weight for the average to the single year in which New Zealand is included in the above-90-percent public debt/GDP group. This one year is when GDP growth in New Zealand was –7.6 percent. The exclusion of years coupled with the country—as opposed to country-year—weighting alone accounts for almost –2 percentage points of under-measured GDP growth. The spreadsheet and transcription errors account for an additional –0.4 percentage point. In total, as we show in Table 3, actual average real growth in the high public debt category is +2.2 percent per year compared to the –0.1 percent per year published in RR. The actual gap between the highest and next highest debt/GDP categories is 1.0 percentage point (i.e., 3.2 percent less 2.2 percent). In other words, with their estimate that average GDP growth in the above-90-percent public debt/GDP group is –0.1 percent, RR overstates the gap by 2.3 percentage points or a factor of nearly two and a half.

Page 21:

Table 3: Published and replicated average real GDP growth, by public debt/GDP category

Method/Source

Public debt/GDP category

Below 30%

30 to 60%

60 to 90%

90% and above

Corrected results

Country-year weighting, all data

4.2

3.1

3.2

2.2

CALCULATIONS:

  • (3.2 – 2.2 ) / 3.2 = 31%
  • 30 to 60%: (3.1 – 2.2 ) / 3.1 = 29%

NOTE: For rigorous documentation of other deceitful claims in this paper and by its authors, see this article by Just Facts.

[11] Paper: “Growth in a Time of Debt.” By Carmen M. Reinhart (University of Maryland) and Kenneth S. Rogoff (Harvard University). American Economic Review, May 2010. Pages 573–578. <scholar.harvard.edu>

Page 575:

Table 1 provides detail on the growth experience for individual countries, but over a much longer period, typically one to two centuries. Interestingly, introducing the longer time-series yields remarkably similar conclusions. Over the past two centuries, debt in excess of 90 percent has typically been associated with mean growth of 1.7 percent versus 3.7 percent when debt is low (under 30 percent of GDP), and compared with growth rates of over 3 percent for the two middle categories (debt between 30 and 90 percent of GDP).

Page 577: “Our main finding is that across both advanced countries and emerging markets, high debt/GDP levels (90 percent and above) are associated with notably lower growth outcomes.”

NOTES: The footnote below is for a similar paper by Reinhart and Rogoff that published in 2012. It found the same general result as the two papers above and does not contain the calculation error.

[12] Paper: “Public Debt Overhangs: Advanced-Economy Episodes Since 1800.” By Carmen M. Reinhart (University of Maryland), Kenneth S. Rogoff (Harvard University), and Vincent R. Reinhart (chief U.S. economist at Morgan Stanley). Journal of Economic Perspectives, Summer 2012. Pages 69–86. <online.wsj.com>

Page 70:

Consistent with a small but growing body of research, we find that the vast majority of high debt episodes—23 of the 26—coincide with substantially slower growth. On average across individual countries, debt/GDP [gross domestic product] levels above 90 percent are associated with an average annual growth rate 1.2 percent lower than in periods with debt below 90 percent debt; the average annual levels are 2.3 percent during the periods of exceptionally high debt versus 3.5 percent otherwise.

CALCULATION: (3.5 – 2.3) / 3.5 = 34%

[13] Search: (“90%” OR “90 percent”) debt (Amherst OR “Political Economy Research Institute”). Google, June 25, 2020. Date delimited from April 15, 2013 to May 5, 2013. <www.google.com>

NOTES:

  • This search produced 577,000 results.
  • Some of the many results that cite this working paper as evidence that large national debts don’t harm economies were published by Politico, the New York Times, the Washington Post, the American Prospect, the New Yorker, Fortune, The Atlantic, Business Insider, Reuters, MSNBC, and NPR.

[14] For rigorous documentation of other deceitful claims in this paper and by its authors, see this article by Just Facts.

[15] Calculated with the dataset: “Table 1.1.1. Percent Change From Preceding Period in Real Gross Domestic Product, [Percent] Seasonally Adjusted at Annual Rates.” United States Department of Commerce, Bureau of Economic Analysis. Last revised December 22, 2011. <www.bea.gov>

NOTE:

  • The calculations show that if inflation-adjusted U.S. economic growth averaged 30% lower from 1970 to 2010 than it actually did, the nation’s GDP would have been about 28% lower in 2010.
  • An Excel file containing the data and calculations is available here.

[16] Paper: “Misconduct Accounts for the Majority of Retracted Scientific Publications.” By Ferric C. Fanga, R. Grant Steen, and Arturo Casadevall. Proceedings of the National Academy of Sciences, October 16, 2012. <www.pnas.org>

A detailed review of all 2,047 biomedical and life-science research articles indexed by PubMed as retracted on May 3, 2012 revealed that only 21.3% of retractions were attributable to error. In contrast, 67.4% of retractions were attributable to misconduct, including fraud or suspected fraud (43.4%), duplicate publication (14.2%), and plagiarism (9.8%). Incomplete, uninformative or misleading retraction announcements have led to a previous underestimation of the role of fraud in the ongoing retraction epidemic. The percentage of scientific articles retracted because of fraud has increased ∼10-fold since 1975. Retractions exhibit distinctive temporal and geographic patterns that may reveal underlying causes.

[17] Blog post: “Inappropriate Manipulation of Peer Review.” By Elizabeth Moylan. Biomed Central, March 26, 2015. <blogs.biomedcentral.com>

Following a thorough investigation, we can now provide a further update on our discovery last year of attempts to manipulate the peer review process at several of our journals. …

The apparent intention was to deceive Editors and positively influence the outcome of peer review by suggesting fabricated reviewers. …

Although we originally found only a handful of affected published articles, a subsequent extensive and systematic search of all of our journals identified 43 articles that were published on the basis of reviews from fabricated reviewers.

[18] “Retraction Note to Multiple Articles in Tumor Biology.” By Torgny Stigbrand. Tumor Biology, April 20, 2017. <link.springer.com>

The Publisher and Editor retract this article in accordance with the recommendations of the Committee on Publication Ethics (COPE). After a thorough investigation we have strong reason to believe that the peer review process was compromised.

This retraction note is applicable to the following articles:

[107 papers listed]

[19] Article: “Reproducibility: A Tragedy of Errors.” By David B. Allison and others. Nature, February 3, 2016. <www.nature.com>

Just how error-prone and self-correcting is science? We have spent the past 18 months getting a sense of that.

We are a group of researchers working on obesity, nutrition and energetics. In the summer of 2014, one of us (D.B.A.) read a research paper in a well-regarded journal estimating how a change in fast-food consumption would affect children’s weight, and he noted that the analysis applied a mathematical model that overestimated effects by more than tenfold. We and others submitted a letter1 to the editor explaining the problem. Months later, we were gratified to learn that the authors had elected to retract their paper. In the face of popular articles proclaiming that science is stumbling, this episode was an affirmation that science is self-correcting.

Sadly, in our experience, the case is not representative. In the course of assembling weekly lists of articles in our field, we began noticing more peer-reviewed articles containing what we call substantial or invalidating errors. These involve factual mistakes or veer substantially from clearly accepted procedures in ways that, if corrected, might alter a paper’s conclusions.

After attempting to address more than 25 of these errors with letters to authors or journals, and identifying at least a dozen more, we had to stop — the work took too much of our time. Our efforts revealed invalidating practices that occur repeatedly (see ‘Three common errors’) and showed how journals and authors react when faced with mistakes that need correction.

[20] Book: Studies on Fermentation: The Diseases of Beer, Their Causes, and The Means of Preventing Them. By Louis Pasteur. Translated with the author’s sanction by Frank Faulkner & D. Constable Robb. Macmillan & Co., 1879. Kraus Reprint Co., 1969.

Page 42:

When we see beer and wine undergo radical changes, in consequence of the harbor which those liquids afford to microscopic organisms that introduce themselves invisibly and unsought into it, and swarm subsequently therein, how can we help imagining that similar changes may and do take place in the case of man and animals? Should we, however, be disposed to think that such a thing must hold true, because it seems both probable and possible, we must, before asserting our belief, recall to mind the epigraph of this work: the greatest aberration of the mind is to believe a thing to be, because we desire it.