


Script / Documentation
Welcome to Just Facts Academy. In this video series, we show you how to become a skilled researcher by using our Standards of Credibility, a simple but extremely effective system for conducting quality research.

In today’s lesson, we discuss the first standard: Comprehensiveness.
It’s a bit of a mouthful, but it’s incredibly important, and unfortunately, often overlooked. So let’s focus in, define this standard, examine a real-world example of why it’s so important, and learn how to use it in our own research.
Comprehensiveness—this 29-point Scrabble word means a complete picture, or all the crucial facts.[1]
Sounds simple enough, but if we’re honest, I’m sure most of us are guilty of not applying this standard at some point.
The truth is—it’s very easy to distort reality by selecting facts or just part of the truth that aligns with certain views—while you ignore or downplay other parts.
Whether intentionally or not, politicians and media outlets do this all too often.[2]
For example, let’s look at the climate change issue and see how both sides get it wrong. That’s right—both sides.
Some claim that climate change is a farce—and they may say something like, “Temperatures haven’t risen since 1997.”[3]
Now, when you look at the data, you see that temperatures did spike in ‘97—so the statement is true.[4] But it’s also misleading.
The fact is the earth’s average temperature has increased by about 0.6 to 0.9 degrees Fahrenheit since the 1980s.[5] This trend suggests warming, but clearly, annual averages fluctuate from year to year. Singling out a year does not prove or disprove a trend. And with these constant fluctuations, this 40-year time frame is not enough to prove or disprove much either.
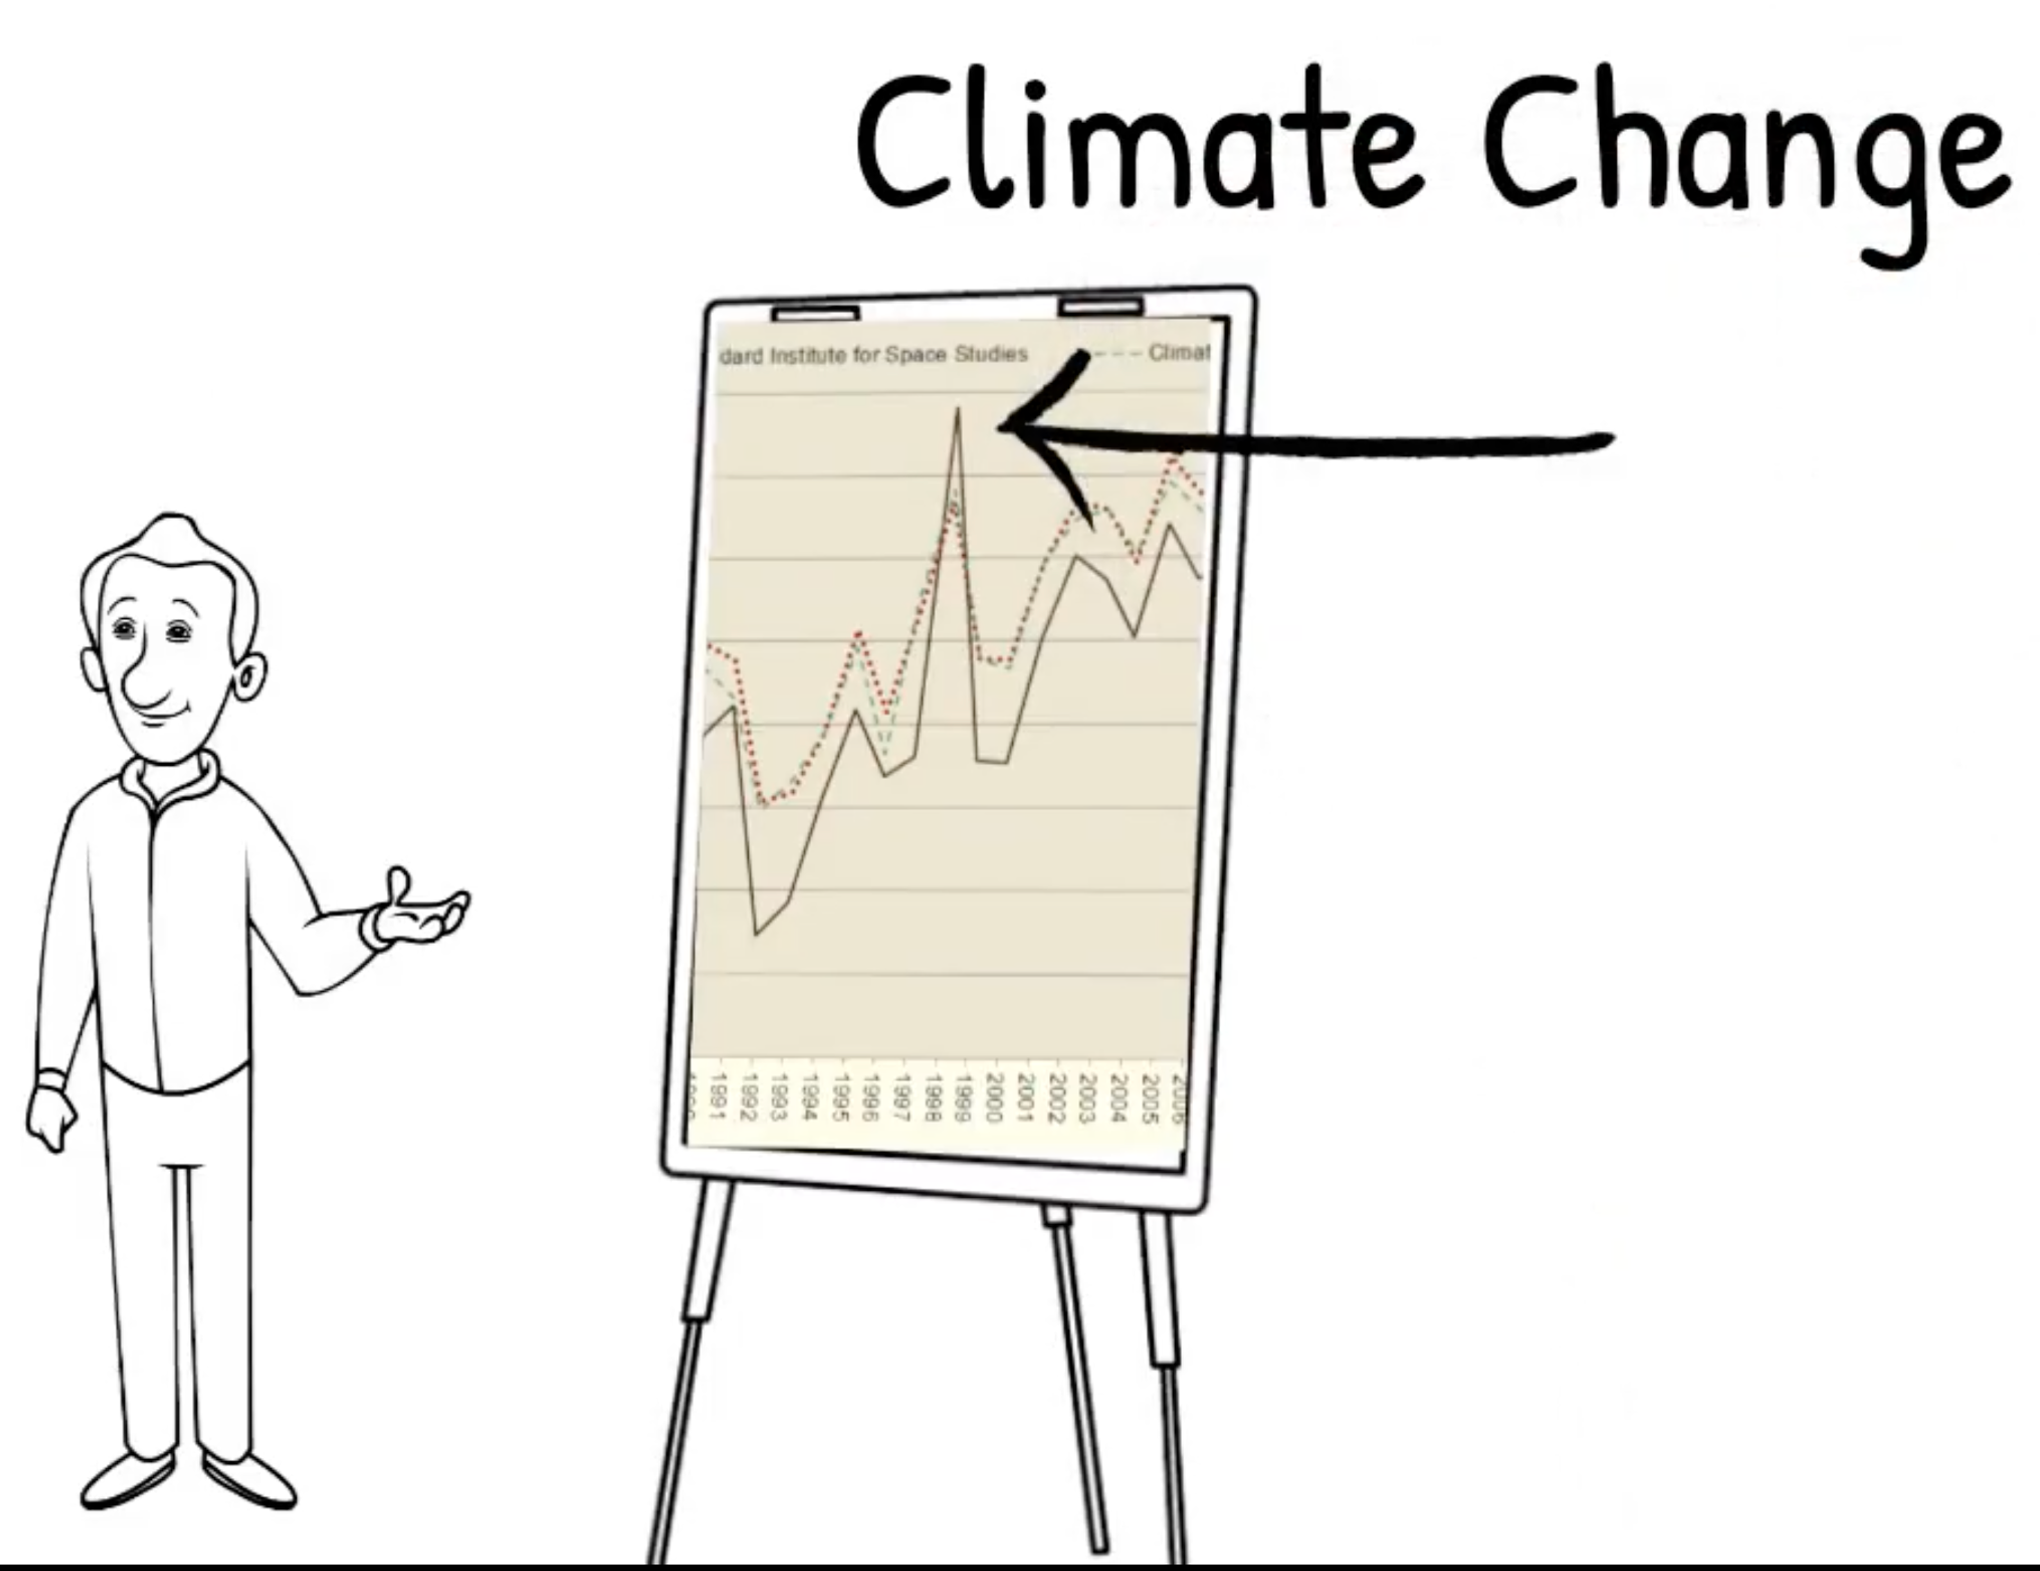
On the other hand, some claim the evidence for abnormal climate change is “overwhelming,” and they point to graphs like this one. They make statements like, “Considering the last millennium, the 19th century was noticeably warmer.”[6]
The graph is hard to argue with—it seems clear—but does it reflect the whole truth?
A comprehensive look at all the data surrounding this WMO report reveals that the trend lines were cherry-picked and spliced together.[7]
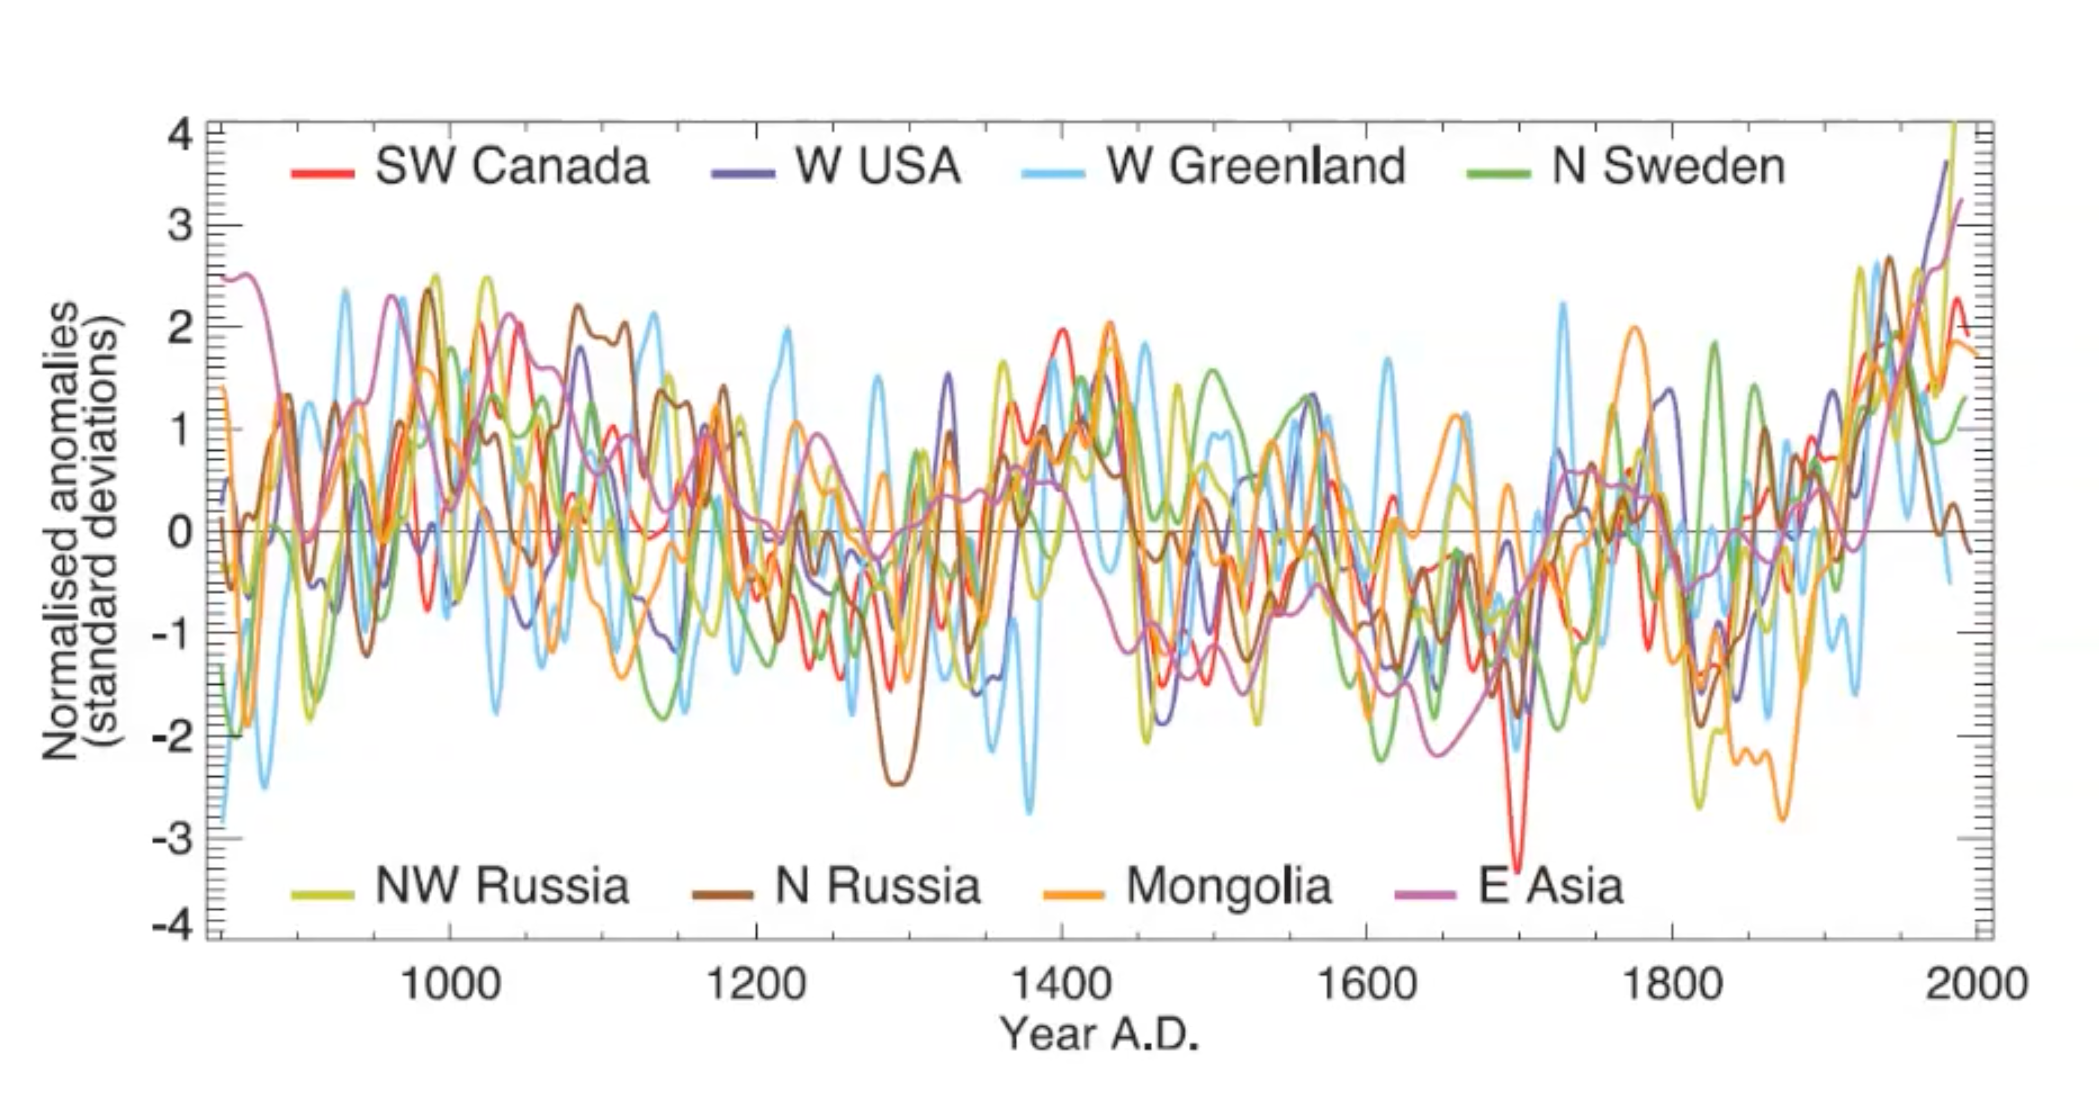
If you look at the non-spliced coincident data, the trend isn’t so clear, if there even is a trend.[8] It’s called a “spaghetti graph” for a reason.[9]
Can you see the importance of comprehensiveness?
These climate change findings influence the decisions of people, companies, and entire nations. We must have comprehensive data to make the best choices possible.
So, how can you be comprehensive in your research?
First and foremost, don’t let your bias or prejudices get in the way. We all have personal viewpoints, and there’s nothing wrong with that, but there is something wrong if we blindly accept anything that appeals to our opinions and dismiss anything that challenges them. That’s a recipe for self-delusion.
So make sure you understand the most compelling evidence on all sides of an issue—not just your side.

Second, you have to put in the work. Use an array of credible primary sources to make sure that you get all of the relevant facts. Don’t settle for secondary sources, the first few Google results, or your favorite news outlet.
If two credible sources provide conflicting data, start digging.
Did you know that the U.S. Census Bureau has 17 definitions of income, and other government agencies use different measures?[10] [11] [12] [13] Some of these measures show dissimilar trends over time—and if you don’t understand exactly what these datasets actually measure—your research can be completely wrong.[14] [15] [16] [17]
Things aren’t always as cut and dry as they seem at first glance. So when we research, it’s important to understand the points, counterpoints and limitations.
So, being comprehensive boils down to two basic principles:

- Be intellectually honest, and
- work hard to find all of the relevant facts.
This will empower you to understand the whole truth—because half the truth can amount to a total lie.
You don’t have to be an Einstein to do any of this. You just need to make the effort and use the comprehensiveness standard, so you can research like a genius.
Footnotes
[1] Entry: “comprehensive.” Merriam-Webster. Accessed June 5, 2021 at <www.merriam-webster.com>
1: covering completely or broadly: inclusive // comprehensive examinations // comprehensive insurance
2: having or exhibiting wide mental grasp // comprehensive knowledge
[2] For numerous examples, visit Just Facts Daily, a project of Just Facts dedicated to publishing highly factual articles about recent news and current events. Most of these articles debunk falsehoods propagated by media outlets, politicians, activists, and others.
[3] Commentary: “The Global-Warming/Climate-Change Hoax: The Hoax of the Twenty-First Century?” By John Wear. Inconvenient History, July 21, 2020. <www.inconvenienthistory.com>
Every single dire warning about the end-of-the-world consequences of global warming has turned out to be wrong, which is not surprising since global temperatures measured from satellite have not risen since 1997/1998.[9]
[9] See www.youtube.com, Patrick Moore, “What They Haven’t Told You About Climate Change.” https://www.youtube.com/watch?v=RkdbSxyXftc and https://www.youtube.com/watch?v=RZlICdawHRA.
[4] Calculated with data from:
a) Dataset: “National Oceanic and Atmospheric Administration Polar-Orbiting Satellites, Microwave Sounding Unit, Lower Troposphere (T2LT), Version 6.0.” National Space Science and Technology Center at the University of Alabama Huntsville and National Climatic Data Center of the National Environmental Satellite, Data, and Information Service. Accessed June 4, 2020 at <www.nsstc.uah.edu>
b) Dataset: “Land-Ocean: Global Means.” NASA, Goddard Institute for Space Studies. Accessed June 5, 2020 at <data.giss.nasa.gov>
c) Webpage: “GISS Surface Temperature Analysis (GISTEMP v4).” NASA, Goddard Institute for Space Studies. Accessed June 5, 2020 at <data.giss.nasa.gov>
“The GISS [Goddard Institute for Space Studies] Surface Temperature Analysis (GISTEMP v4) is an estimate of global surface temperature change. … The following are … temperature anomalies, i.e. deviations from the corresponding 1951–1980 means.”
d) Dataset: “Global Temperature.” University of East Anglia, School of Environmental Sciences, Climatic Research Unit. Accessed June 5, 2020 at <www.cru.uea.ac.uk>
e) Webpage: “Global Temperature Record.” University of East Anglia, School of Environmental Sciences, Climatic Research Unit. Accessed June 5, 2020 at <www.cru.uea.ac.uk>
“The time series shows the combined global land and marine surface temperature record from 1850 to 2019. … This time series is compiled jointly by the Climatic Research Unit and the UK Met Office Hadley Centre.”
NOTES:
- An Excel file containing the data and calculations is available here.
- For a chart of the data and more details about the dataset, visit Just Facts’ research on global warming, especially the section “Global Temperature Changes.”
[5] Calculated with data from:
a) Dataset: “National Oceanic and Atmospheric Administration Polar-Orbiting Satellites, Microwave Sounding Unit, Lower Troposphere (T2LT), Version 6.0.” National Space Science and Technology Center at the University of Alabama Huntsville and National Climatic Data Center of the National Environmental Satellite, Data, and Information Service. Accessed June 4, 2020 at <www.nsstc.uah.edu>
b) Dataset: “Land-Ocean: Global Means.” NASA, Goddard Institute for Space Studies. Accessed June 5, 2020 at <data.giss.nasa.gov>
c) Webpage: “GISS Surface Temperature Analysis (GISTEMP v4).” NASA, Goddard Institute for Space Studies. Accessed June 5, 2020 at <data.giss.nasa.gov>
“The GISS [Goddard Institute for Space Studies] Surface Temperature Analysis (GISTEMP v4) is an estimate of global surface temperature change. … The following are … temperature anomalies, i.e. deviations from the corresponding 1951–1980 means.”
d) Dataset: “Global Temperature.” University of East Anglia, School of Environmental Sciences, Climatic Research Unit. Accessed June 5, 2020 at <www.cru.uea.ac.uk>
e) Webpage: “Global Temperature Record.” University of East Anglia, School of Environmental Sciences, Climatic Research Unit. Accessed June 5, 2020 at <www.cru.uea.ac.uk>
“The time series shows the combined global land and marine surface temperature record from 1850 to 2019. … This time series is compiled jointly by the Climatic Research Unit and the UK Met Office Hadley Centre.”
NOTES:
- An Excel file containing the data and calculations is available here.
- For a chart of the data and more details about the dataset, visit Just Facts’ research on global warming, especially the section “Global Temperature Changes.”
[6] “WMO Statement on the Status of the Global Climate in 1999.” World Meteorological Organization, March 2000. <library.wmo.int>
Inside cover:
Front cover: Northern Hemisphere temperatures were reconstructed for the past 1000 years (up to 1999) using palaeoclimatic records (tree rings, corals, ice cores, lake sediments, etc.), along with historical and long instrumental records. The data are shown as 50-year smoothed differences from the 1961–1990 normal. Uncertainties are greater in the early part of the millennium (see page 4 for further information†). For more details, readers are referred to the PAGES newsletter (Vol. 7, No. 1: March 1999, also available at <www.pages.unibe.ch>) and the National Geophysical Data Center (<www.ngdc.noaa.gov>). (Sources of data: P.D. Jones, K.R. Briffa and T.J. Osborn, University of East Anglia, UK; M.E. Mann, University of Virginia, USA; R.S. Bradley, University of Massachusetts, USA; M.K. Hughes, University of Arizona, USA; and the Hadley Centre, The Met. Office).
Page 4:
Despite their different emphases on annual or extended summer seasonal temperatures and their different geographical biases, all the reconstructions (shown on the front cover as 50-year smoothed differences from the 1961–1990 normal) indicate that against the background of the millennium as a whole, the 20th century was unusually warm.
[7] See Just Facts’ research on this WMO report, along with the emails that the scientists who created it sent to each other.
[8] Report: “Climate Change 2007: The Physical Science Basis.” Edited by S. D. Solomon and others. World Meteorological Organization/United Nations Environment Programme, Intergovernmental Panel on Climate Change. Cambridge University Press, 2007.
Chapter 6: “Palaeoclimate.” By Eystein Jansen and others. Pages 433–497. <www.ipcc.ch>
Page 468:
Box 6.4, Figure 1. The heterogeneous nature of climate during the “Medieval Warm Period” is illustrated by the wide spread of values exhibited by the individual records that have been used to reconstruct NH mean temperature. These consist of individual, or small regional averages of, proxy records collated from those used by Mann and Jones (2003), Esper and others (2002) and Luckman and Wilson (2005), but exclude shorter series or those with no evidence of sensitivity to local temperature. These records have not been calibrated here, but each has been smoothed with a 20-year filter and scaled to have zero mean and unit standard deviation over the period 1001 to 1980.
NOTE: For more context, see visit Just Facts’ research on global warming, especially the subsection “Proxies.”
[9] Paper: “A Statistical Analysis of Multiple Temperature Proxies: Are Reconstructions of Surface Temperatures Over the Last 1000 Years Reliable?” By Blakeley B. McShane and Abraham J. Wyner. Annals of Applied Statistics, April 20, 2011. <arxiv.org>
Page 2: “Figure 2 is a ‘spaghetti graph’ of multiple reconstructions appearing in Mann et al. (2008).”
[10] Paper: “Alternative Measures of Household Income: BEA Personal Income, CPS Money Income, and Beyond.” By John Ruser, Adrienne Pilot, and Charles Nelson. U.S. Department of Commerce, Bureau of Economic Analysis, November 2004. <apps.bea.gov>
Pages 10–11:
Since the early 1980s, the Census Bureau has published analysis showing the effect of using a broadened income definition on measures of economic well-being. Currently, annual Census Bureau reports on income and poverty show the effect of using an income measure that includes the effect of noncash benefits and taxes on the distribution of income, prevalence of poverty, and level of income inequality based on the 17 income definitions as summarized below:
• Definition 1: official money income
• Definition 1b: definition 1 plus capital gains/losses less taxes
• Definition 2: definition 1 less government cash transfers
• Definition 3: definition 2 plus capital gains/less capital losses
• Definition 4: definition 3 plus the value of employment-related health benefits
• Definition 5: definition 4 less Social Security payroll taxes
• Definition 6: definition 5 less federal income taxes (excluding the Earned • Income Tax Credit)
• Definition 7: definition 6 plus the Earned Income Tax Credit
• Definition 8: definition 7 less state income taxes
• Definition 9: definition 8 plus non-means-tested government cash transfers
• Definition 10: definition 9 plus the value of Medicare
• Definition 11: definition 10 plus the value of regular-price school lunches
• Definition 12: definition 11 plus means-tested cash transfers
• Definition 13: definition 12 plus the value of Medicaid
• Definition 14a: definition 13 plus the value of other means-tested government noncash transfers less Medicare and Medicaid
• Definition 14: definition 13 plus the value of other means-tested government noncash transfers
• Definition 15: definition 14 plus net imputed return on equity in own home
Obviously, the construction of 17 definitions of income was not based on the premise that each of these definitions represented a viable income concept. Rather, the construction of so many income definitions was to facilitate the analysis that examines which components of a broadened income measure are most responsible for the significant changes in income summary measures as one transitions from the money income concept to an expanded definition of well-being. That said, there are several expanded income definitions that the Census Bureau has found useful to track trends and differences between groups. For example, the 2002 CPS income report (U.S. Bureau of the Census, 2003) highlighted four definitions of income in addition to the traditional money income definition. These were definitions 1b, 14a, 14, and 15. It should be noted that in the 2002 income report for the first time these alternative income measures were featured in the main body of the report and presented along with the money income measures (in previous reports these figures were examined in supplemental report sections).
[11] Webpage: “Comparability of Current Population Survey Income Data with Other Data.” U.S. Census Bureau. Accessed January 13, 2017 at <www.census.gov>
The concepts used in the SIPP [Survey of Income and Program Participation] and the March supplement to the Current Population Survey (CPS) differ in some regards. These differences occur primarily between components of the income definition used in each survey and the manner in which certain reference units are categorized. An explanation of these differences follows.
Two basic units of reference common to both the SIPP and CPS are people and households. Groups of people living together, when combined based on relationship, form family units. A family refers to a group of two or more people related by birth, marriage, or adoption who reside together (one of whom is the householder). Two or more people who live together and are related to one another, but not related to the householder, form an unrelated subfamily. People in unrelated subfamilies are not included in the count of family members in the CPS, but are included as family members for the SIPP.
A unique feature of a longitudinal survey, such as SIPP, is its ability to capture change over time. A cross-sectional survey, such as CPS, does not have this feature and can only provide a series of snapshots of the socio-economic conditions that exist at different fixed points in time. CPS data are based on the demographic characteristics as they existed at the time the survey was conducted and are applied to the economic characteristics that existed for the previous calendar year. The demographic data in the SIPP are collected with the economic data throughout the calendar year and are likely to have changed during the year. In order to incorporate the effect of changes over time in family compositions in measures of SIPP income data, the data are presented for people rather than families. People are characterized by the income of their respective family unit based on living arrangements each month during the calendar year.
The definition of income used in the SIPP is basically the same as in the CPS. It reflects money income before taxes and does not include the value of noncash benefits such as employer-provided health insurance, food stamps, or Medicaid. Differences do exist however, they are:
• Accrued interest on Individual Retirement Accounts (IRA’s) KEOGH retirement plans, 401(k), and U.S. savings bonds; and educational assistance are excluded in SIPP and counted in the CPS.
• Lump-sum or one-time payments such as inheritances, insurance settlements, and lump-sum payments from a pension or retirement plan are counted in the SIPP and excluded in the CPS.
• Self-employment income (both farm and nonfarm) is counted in the CPS as a net amount, gross receipts minus operating expenses. In the SIPP, self-employment income includes a regular salary and/or any other income from the business.
[12] Article: “Comparison of BEA Estimates of Personal Income and IRS Estimates of Adjusted Gross Income.” By Mark Ledbetter. U.S. Department of Commerce, Bureau of Economic Analysis, Survey of Current Business, November 2007. <apps.bea.gov>
Page 35:
The Bureau of Economic Analysis (BEA) annually publishes a comparison of BEA’s measure of personal income and the Internal Revenue Service (IRS) measure of adjusted gross income (AGI); both are widely used measures of household income. This comparison features the “AGI gap,” which is the difference between BEA-derived estimates of adjusted gross income and the IRS estimate of adjusted gross income.
Key Terms
Adjusted gross income (AGI), for Federal income tax purposes, includes all income that is received in the form of money, property, and services that is not explicitly exempt by law.
Personal income is the income received by individuals, nonprofit institutions serving households, private noninsured welfare funds, and private trust funds from all sources. It includes income that is taxed, that is partly taxed (such as social security benefit payments), and that is tax-exempt (such as tax-exempt interest, nontaxable The AGI gap for each type of income is the difference transfer payments, and Medicare, Medicaid, and welfare benefit payments). It is the sum of “compensation of employees (received),” proprietors’ income, rental income, personal income receipts on assets, and personal current transfer receipts; contributions for government social insurance is subtracted. Personal income includes imputed income, but it excludes net gains from the sale of assets (capital gains), pension benefit payments, and employee and self-employed contributions for government social insurance. …
BEA-derived adjusted gross income is BEA’s conceptual measure of adjusted gross income without taxpayer misreporting. It is based on IRS tabulations of data from individual income tax returns, corporate income tax returns, nonfarm sole proprietorship income tax returns, partnership income tax returns, and extrapolated estimates for tax-exempt income and for private foundation income.
The AGI gap is the difference between the BEA-derived adjusted gross income and IRS adjusted gross income. The AGI gap for each type of income is the difference between the BEA-derived adjusted gross income for that type of income and the reallocated IRS adjusted gross income.
The relative AGI gap for each type of income shows the AGI gap by type of income as a percentage of the BEA-derived adjusted gross income by type of income.
Misreporting adjustments are adjustments to IRS source data that are designed to correct for the effects of taxpayer misreporting in the tax return tabulations and economic census data used in the NIPAs [National Income and Product Accounts]. These adjustments account for income that is underreported on tax returns and for the income that is earned by individuals who do not file tax returns.
[13] Webpage: “Frequently Asked Questions Related to the Poverty Guidelines and Poverty.” U.S. Department of Health & Human Services, Office of the Assistant Secretary for Planning and Evaluation. Accessed June 5, 2021 at <aspe.hhs.gov>
Are the Poverty Guidelines Before-Tax or After-Tax? Are They Gross Income or Net Income? What Definition of Income Is Used with the Poverty Guidelines?
There is no simple answer to these questions. When determining program eligibility, some agencies compare before-tax income to the poverty guidelines, while other agencies compare after-tax income. Likewise, eligibility can be dependent on gross income, net income, or some other measure of income. Federal, state, and local program offices that use the poverty guidelines for eligibility purposes may define income in different ways. To find out the specific definition of income (before-tax, after-tax, etc.) used by a particular program or activity, one must consult the office or organization that administers that program.
While there is no standard definition of income for program eligibility purposes, the Census Bureau uses a standard definition of income for computing poverty statistics based on the official poverty thresholds. More information is available on the Census Bureau’s web site.
[14] Paper: “Integration of Micro and Macro Data on Consumer Income and Expenditures.” By Clinton P. McCully. U.S. Bureau of Economic Analysis, October 23, 2012. <www.justfacts.com>
Page 1:
Data on personal income and expenditures from the National Income and Product Accounts (NIPAs) produced by the Bureau of Economic Analysis (BEA) and from those based on household surveys have shown divergent trends in recent years. From 2000 to 2010, BEA estimates of real per capita disposable personal income (DPI) increased by 12 percent, while the Census Bureau’s Current Population Survey Statistical and Economic Supplement (CPS–ASEC) estimates of real median household money income decreased by 7 percent. Consumer expenditure data have shown similar differences between the BEA estimates and those based on the Bureau of Labor Statistics’ (BLS) Consumer Expenditure Survey (CE) program.
[15] Working paper: “A Comparison of Income Concepts: IRS Statistics of Income, Census Current Population Survey, and BLS [Bureau of Labor Statistics] Consumer Expenditure Survey.” By Eric L. Henry and Charles D. Day. Internal Revenue Service, 2005. <www.irs.gov>
Page 149:
Several Federal Government agencies produce statistics on individual and household income. Because of the differing purposes to which their data will be put, agencies use different definitions for income (income concepts), as well as different reporting units, sample designs, collection modes, and processing rules. Data users are faced with an array of choices, often without much help to sort out which data series best meets their needs or much guidance to reconcile results based on different sources of data.
[16] Webpage: “Income: About.” U.S. Census Bureau. Accessed October 27, 2020 at <www.census.gov>
Census money income is defined as income received on a regular basis (exclusive of certain money receipts such as capital gains) before payments for personal income taxes, social security, union dues, medicare deductions, etc. Therefore, money income does not reflect the fact that some families receive part of their income in the form of noncash benefits, such as food stamps, health benefits, subsidized housing, and goods produced and consumed on the farm. In addition, money income does not reflect the fact that noncash benefits are also received by some nonfarm residents which may take the form of the use of business transportation and facilities, full or partial payments by business for retirement programs, medical and educational expenses, etc.
Data users should consider these elements when comparing income levels. Moreover, users should be aware that for many different reasons there is a tendency in household surveys for respondents to underreport their income. Based on an analysis of independently derived income estimates, the Census Bureau determined that respondents report income earned from wages or salaries much better than other sources of income and that the reported wage and salary income is nearly equal to independent estimates of aggregate income.
The Census Bureau also derives alternative income measures that systematically remove or add various income components such as deducting payroll taxes and federal and state income taxes and including the value of specific noncash benefits, food stamps, school lunches, housing subsidies, health insurance programs, and return on home equity.
[17] Paper: “Alternative Measures of Household Income: Personal Income, CPS Money Income, and Beyond.” By John Ruser, Adrienne Pilot, and Charles Nelson. U.S. Bureau of Economic Analysis, November 2004. <apps.bea.gov>
Pages 1–2:
Two of the most widely used measures of household income are BEA’s [Bureau of Economic Analysis’s] personal income and the Census Bureau’s money income. These two statistics spring from different traditions of measurement—personal income from national income accounting and money income from income distribution analysis. …
• The Current Population Survey (CPS) Annual Social and Economic Supplement is the source of the Census Bureau’s official national estimates of poverty. CPS money income is defined as total pre-tax cash income earned by persons, excluding certain lump sum payments and excluding capital gains.
• BEA estimates that personal income for the US was $8.678 trillion in 2001, as compared to a CPS money income estimate of $6.446 trillion.2 Over 64 percent of this $2.232 trillion gap—$1.429 trillion—can be accounted for by differences in the income types that are included in the two measures, including the $982 billion of property income that is counted in personal income but not in CPS money income.
• Half of the remaining $804 billion money income gap can be accounted for by BEA adjustments to proprietors’ income and wages and salaries for underreporting in BEA source data.